Monitoring DNS with the DNS Console
The DNS management console includes functionality that enables you to use the console to monitor DNS activity:
-
Event Logging tab: You can access the Event Logging tab located within the Properties dialog box of the DNS server to specify the DNS events that you want to monitor. Through the Event Logging tab, you can limit the events which are written to the DNS Events log.
-
Monitoring tab: The Monitoring tab is also located within the Properties dialog box of the DNS server. This tab allows you to test querying of the DNS server. The monitoring tests that you can run from the Monitoring tab are:
-
A simple query test
-
A recursive query test
-
You can also specify that the DNS server automatically performs testing at an interval that you set.
-
How to configure which DNS events should be logged
-
Click Start, Administrative Tools, and then click DNS.
-
In the console tree, right-click the DNS server that you want to configure, and then select Properties to open the DNS Server’s Properties dialog box.
-
Click the Event Logging tab.
-
The options which you can select to limit DNS event logging are:
-
No events
-
Errors only
-
Errors and warnings
-
All events
-
How to test querying of the DNS server
-
Click Start, Administrative Tools, and then click DNS.
-
In the console tree, right-click the DNS server that you want to perform testing on, and then select Properties from the shortcut menu.
-
Click the Monitoring tab.
-
The options which you can select to test querying of the DNS server are listed below. You an select one of these options, or both options:
-
A Simple Query Against This DNS Server
-
A Recursive Query To Other DNS Servers
-
-
Click the Test Now button.
-
The results of the test are displayed in the Test Results area of the Monitoring tab.
-
If you want the DNS server to automatically perform testing, select the Perform Automatic Testing At The Following Interval checkbox. In the Test Interval field, specify the interval that should be used.
-
Click OK.
Monitoring DNS with System Monitor
The System Monitor utility is the main tool used to monitor system performance. System Monitor can track various processes on the Windows system in real time. The utility uses a graphical display that you can use to view current data, or log data. You can specify specific elements or components that should be tracked on the local computer and remote computers. You can determine resource usage by monitoring trends. System Monitor can be displayed in a graph, histogram, or report format. System Monitor uses objects, counters and instances to monitor the system
You can use System Monitor to monitor real-time performance statistics on your DNS server. The DNS performance object in System Monitor contains numerous DNS performance counters which you can use to monitor the activity of your DNS server.
You can use the DNS performance counters to generate statistics on:
-
Total DNS server performance
-
DNS server memory usage
-
TCP statistics
-
UDP statistics
-
Full zone transfer requests – AXFR requests.
-
Incremental zone transfer requests – IXFR requests.
-
DNS Notify events
-
Dynamic update
-
Secure dynamic updates
-
Recursive queries
-
WINS lookup statistics
To start System Monitor,
-
Click Start, Administrative Tools, and then click Performance.
-
When the Performance console opens, open System Monitor
The DNS performance counters that you can monitor to track DNS performance are:
-
AXFR Request Received; total number of full zone transfer requests which the master DNS server received.
-
AXFR Request Sent; total number of full zone transfer requests which were sent by a secondary DNS server.
-
AXFR Response Received; total number of full zone transfer responses which were received by a secondary DNS server.
-
AXFR Success Received; total number of successful full zone transfers which were received by a secondary DNS server.
-
AXFR Success Sent; total number of successful full zone transfers sent by the master DNS server.
-
Caching Memory; total caching memory being used by the DNS server.
-
Database Node Memory; total database node memory being used by DNS server.
-
Dynamic Update NoOperation; total number of empty dynamic update requests received by the DNS server
-
Dynamic Update NoOperation/sec; the rate at which empty dynamic update requests are being received by the DNS server.
-
Dynamic Update Queued; total number of dynamic updates queued by this specific DNS server.
-
Dynamic Update Received; total number of dynamic updates being received by this specific DNS server.
-
Dynamic Update Received/sec; the rate at which dynamic update requests are being received by the DNS server.
-
Dynamic Update Rejected; total number of dynamic updates which the DNS server rejected.
-
Dynamic Update TimeOuts; total number of dynamic update timeouts of the DNS server.
-
Dynamic Update Written to Database/sec; the rate at which the DNS server writes dynamic updates to the database.
-
IXFR Request Received; total number of incremental zone transfer requests which the master DNS server received.
-
IXFR Request Sent; total number of incremental zone transfer requests which were sent by a secondary DNS server.
-
IXFR Response Received; total number of incremental zone transfer responses which were received by a secondary DNS server.
-
IXFR Success Received; total number of successful incremental zone transfers which were received by a secondary DNS server.
-
IXFR Success Sent; total number of successful incremental zone transfers sent by the master DNS server.
-
IXFR TCP Success Received; total number of successful TCP incremental zone transfers which were received by a secondary DNS server.
-
IXFR UDP Success Received; total number of successful UDP incremental zone transfers which were received by a secondary DNS server.
-
Nbstat Memory; total Nbstat memory being used by DNS server.
-
Notify Received; total number of notify messages which the secondary DNS received.
-
Notify Sent; total number of notify messages that the master DNS server sent.
-
Record Flow Memory; total record flow memory being used by DNS server.
-
Recursive Queries; total number of recursive queries that the DNS server received.
-
Recursive Queries/sec; the rate at which the DNS server receives recursive queries.
-
Recursive Query Failure; the number of recursive query failures.
-
Recursive Query Failure/sec; the rate at which recursive query failures are occurring.
-
Recursive TimeOuts; total number of recursive query timeouts.
-
Recursive TimeOut/sec; the rate at which recursive query timeouts are occurring.
-
Secure Update Failure; total number of secure updates that failed on the DNS server.
-
Secure Update Received; total number of secure update requests that the specific DNS server received.
-
Secure Update Received/sec; indicates the rate at which the DNS server receives secure update requests.
-
TCP Message Memory; TCP message memory being used by the DNS server.
-
TCP Query Received; total number of TCP queries which were received by the DNS server.
-
TCP Query Received/sec; the rate at which the DNS server receives TCP queries.
-
TCP Response Sent total number of TCP responses which the DNS server sent.
-
TCP Response Sent/sec; the rate at which the DNS server sends TCP responses.
-
Total Query Received; indicates the total number of queries that the DNS server received.
-
Total Query Received/sec; indicates the rate at which the DNS server receives queries.
-
Total Response Sent; indicates the total number of responses that the DNS server sent.
-
Total Response Sent/sec; indicates the rate at which the DNS server sends responses.
-
UDP Message Memory; UDP message memory being used by the DNS server.
-
UDP Query Received; total number of UDP queries which were received by DNS server.
-
UDP Query Received/sec; the rate at which the DNS server receives UDP queries.
-
UDP Response Sent; total number of UDP responses which the DNS server sent.
-
UDP Response Sent/sec; the rate at which the DNS server sends UDP responses
-
WINS Lookup Received; indicates the total number of WINS lookup requests that the server received.
-
WINS Lookup Received/sec; indicates the rate at which the server received WINS lookup requests.
-
WINS Response Sent; indicates the total number of WINS lookup responses that was sent.
-
WINS Response Sent/sec; indicates the rate at which WINS lookup responses are being sent.
-
WINS Reverse Lookup Received; indicates the total number of WINS reverse lookup requests received.
-
WINS Reverse Lookup Received/sec; indicates the rate at which the server received WINS reverse lookup requests.
-
WINS Reverse Response Sent; indicates the total number of WINS reverse lookup responses that was sent.
-
WINS Reverse Response Sent/sec; indicates the rate at which WINS reverse lookup responses are being sent.
-
Zone Transfer Failure; indicates the total number of failed zone transfers of the master DNS server.
-
Zone Transfer Request Received; total number of zone transfer requests which the master DNS server received.
-
Zone Transfer SOA; total number of zone transfer SOA requests which were sent by a secondary DNS server.
-
Zone Transfer Success; indicates the total number of successful zone transfers of the master DNS server.
How to specify DNS performance counters using System Monitor
-
Click Start, Administrative Tools, and then click Performance.
-
When the Performance console opens, open System Monitor.
-
Click Add Counters to open the Add Counters dialog box.
-
In the Performance Object drop-down list box, select DNS.
-
If you want to monitor all counters associated with the DNS object, click the All Counters option.
-
If you want to only monitor certain counters, click the Select counter from list option, select the performance counter that you want to monitor, and then click the Add button.
-
Repeat Step 6 for each performance counter that you want to monitor.
-
Click the All Instances option to track all instances, or click the Select Instances From List option to individually select instances
-
Click Close.
Monitoring DNS with Network Monitor
You can use Network Monitor to monitor network traffic, and to troubleshoot network issues or problems. Network Monitor shipped with Windows Server 2003 allow you to monitor network activity and use the gathered information to manage and optimize traffic, identify unnecessary protocols, and to detect problems with network applications and services. In order to capture frames, you have to install the Network Monitor application and the Network Monitor driver on the server where you are going to run Network Monitor. The Network Monitor driver makes it possible for Network Monitor to receive frames from the network adapter
You can use Network Monitor to monitor and capture DNS specific data. You can use the Network Monitor version included in Windows Server 2003 to capture and analyze the traffic being received by the DNS server. Before you can use Network Monitor to capture DNS data, you first have to install it. You then have to run Network Monitor from the DNS server. The Network Monitor driver is automatically installed when you install Network Monitor.
How to install Network Monitor on the DNS server
-
Click Start, and then click Control Panel.
-
Click Add Or Remove Programs to open the Add Or Remove programs dialog box.
-
Click Add/Remove Windows Components.
-
Select Management and Monitoring Tools and click the Details button.
-
On the Management and Monitoring Tools dialog box, select the Network Monitor Tools checkbox and click OK.
-
Click Next when you are returned to the Windows Components Wizard.
-
If prompted during the installation process for additional files, place the Windows Server 2003 CD-ROM into the CD-ROM drive.
-
Click Finish on the Completing the Windows Components Wizard page.
How to capture DNS data with Network Monitor
-
Open Network Monitor.
-
Use the Tools menu to click Capture, and then click Start.
-
If you want to examine captured data during the capture, select Stop And View from the Capture menu.
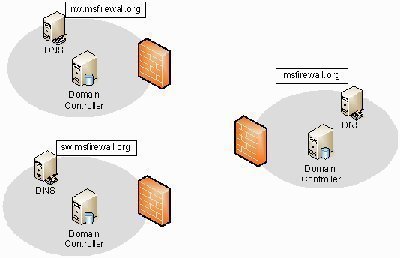
Monitoring DNS with Replication Monitor
Because Active Directory-integrated zones store their zone data in Active Directory, and not in DNS zone files, you have to monitor and examine replication for Active Directory–integrated zones by examining Active Directory replication. Replication Monitor (Replmon) is a graphical management tool included in the Windows Support Tools that can be used to monitor replication for Active Directory-integrated zones.
Replication Monitor can be used to perform the following activities:
-
View the Active Directory replication topology or replication information in a highly useful graphical format.
-
Manually force replication between domain controllers.
-
Poll replication partners, and display an account of successful replication events and failed replication events.
-
Determine whether domain controllers are replicating Active Directory information correctly.
-
Determine when replication partners fails.
-
Determine what changes have not yet been replicated from a specified replication partner.
-
Determine and monitor the status of Active Directory replication
Because Replication Monitor is not automatically installed during the installation of Windows Server 2003, you have to manually install it. Replication Monitor is included in the Windows Support Tools.
The information displayed in the main Replication Monitor window is listed below:
-
Naming contexts: All the naming contexts that a server contains are displayed here.
-
Replication partners: Each naming context shows the inbound replication partners for that particular naming context.
-
Server icons: Server icons enable you to determine information at a glance.
-
Log entries: The replication log entries for the connection are displayed in the right pane.
How to install Replication Monitor
-
Insert the Windows Server 2003 CD-ROM in the CD-ROM drive.
-
Using Windows Explorer, locate the SUPPORTTOOLSfolder on the Windows Server 2003 CD-ROM.
-
Double-click the SUPTOOLS.MSI file.
-
The Support Tools Installation Wizard starts.
-
Use the prompts of the wizard to install the Windows Support Tools.
How to start Replication Monitor
-
Click Start, Run, and enter replmon in the Run dialog box.
-
When the Replication Monitor opens, in the console tree, right-click Monitored Servers and select Add Monitored Server from the shortcut menu.
-
The Add Monitored Server Wizard now starts.
-
Select te Add The Server Explicitly By Name option. Click Next.
-
In the Add Server To Monitor page, use the Enter The Name Of The Server To Monitor Explicitly box to specify the name of the server that should be monitored.
-
Click Finish.
-
The server that you specified for monitoring is now displayed in the console tree.
How to check for replication errors
-
Click Start, Run, and enter replmon in the Run dialog box.
-
When the Replication Monitor opens, click the Action menu.
-
Select Domain, and then select Search Domain Controllers For Replication Errors.
-
Click the Run Search button.
-
Specify the name of the domain that should be searched.
-
Replication Monitor next displays any replication errors which it detects during its search.
-
Click Close.
How to manually force replication between domain controllers
-
Click Start, Run, and enter replmon in the Run dialog box.
-
In the console tree, right-click the directory partition that contains the DNS zone data that you want to force replication for, and then select Synchronize This Partition With All Servers from the shortcut menu.
-
Click Yes to verify that you want to proceed with replication.
Monitoring DNS Events in Event Viewer
Even though the DNS management console contains a copy of the DNS event log, you can also use Event Viewer to view information on DNS events. Event Viewer stores events that are logged in a system log, application log, and security log. You can access Event Viewer from the Administrative Tools folder. A Windows Server 2003 computer running as a DNS server has an additional log displayed in Event Viewer, called the DNS Server log. This log contains errors and any important events that are reported by the DNS server.
A few of the more common DNS events are:
-
Event ID 2: Indicates that the DNS server has started.
-
Event ID 3: Indicates that the DNS server has shut down.
-
Event ID 414: Indicates that the DNS server has no primary DNS suffix specified.
-
Event ID 708: Indicates that because the DNS server found no primary or secondary zone type, it will run as a caching-only DNS server.
The Command-line Tools for Monitoring DNS
The command-line tools that you can use to monitor DNS are:
-
Dnscmd: The Dnscmd tool is included in the Windows Support Tools. You can use Dnscmd to perform various functions, including the following:
-
Create zones and delete zones.
-
View and update resource records in a zone.
-
-
DNSLint: The DNSLint tool is also included in the Windows Support Tools. You can use DNSLint to examine/troubleshoot Active Directory DNS issues. DNSLint can examine multiple DNS servers as a single function. It can also display results as a HTML file.
-
NSLookup: You can use NSLookup if you want to examine results for queries performed against a particular DNS server. NSLookup has two modes:
-
Interactive mode: You can enter multiple commands at the NSLookup command prompt.
-
Noninteractive mode: You can enter a single command with options at the command prompt.
-
Troubleshooting the DNS Server using Logging
When you install Windows Server 2003 DNS, all DNS events are automatically logged to the DNS Events log. The DNS Events log contains errors and other significant events logged by the DNS server. You can view the contents of the DNS Events log by using Event Viewer, or by using the DNS management console. In Event Viewer, the log is called the DNS Server log. In the DNS console, the log can be viewed from the Event Viewer node in the console tree. The DNS Events log by default logs all DNS events. You can use the DNS console to change this default configuration setting.
The Windows Server 2003 Debug Logging feature can be enabled if you need to troubleshoot and resolve DNS issues that you have difficulty in resolving. For debug logging, another log file called the DNS debug log (Dns.log) is maintained by the DNS Server service. The debug logging feature is by default disabled. When enabled, debug logging can write all packets that are being sent to the DNS server in the Dns.log. The Dns.log is located in the WINDOWSSystem32Dns folder.
The DNS server can be configured to generate a log file which records and contains the information listed below:
-
Queries
-
Dynamic updates
-
Number of queries sent by the specific DNS server.
-
Number of queries received by the specific DNS server.
-
Number of requests received via a TCP port.
-
Number of requests received via a UDP port.
-
Number of full packets sent by the specific DNS server.
-
Number of notification messages from the other name servers.
How to limit the events that the DNS server logs in the DNS Events log
-
Click Start, Administrative Tools, and then click DNS.
-
In the console tree, right-click the DNS server that you want to configure, and then select Properties to open the DNS Server’s Properties dialog box.
-
Click the Event Logging tab.
-
Choose one the following options:
-
No events
-
Errors only
-
Errors and warnings
-
All events
-
-
Click OK
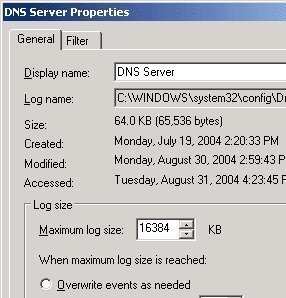
How to configure the DNS Events log
-
Click Start, Administrative Tools, and then click DNS to open the DNS console.
-
In the DNS console tree, right-click DNS Events log and then select Properties from the shortcut menu.
-
The DNS Events Properties dialog box opens.
-
On the General tab, you can configure the following settings:
-
DNS log file name.
-
DNS log file location.
-
Maximum size of the log file.
-
Specify the actions that should occur when the maximum log file is reached.
-
-
Click the Filter tab of the DNS Events Properties dialog box.
-
The options on the Filter tab allow you to limit the events that are logged to the DNS Events log, based on the following parameters:
-
Event Type
-
Event Source
-
Event Category
-
Event ID
-
User/Computer
-
Date
-
-
Click OK
How to enable and configure debug logging for the DNS server
-
Click Start, Administrative Tools, and then click DNS to open the DNS console.
-
In the console tree, right-click the DNS server that you want to enable debug logging for, and then select Properties from the shortcut menu..
-
Click the Debug Logging tab.
-
Select the Log Packets For Debugging checkbox to enable the debug logging feature on the DNS server.
-
The configuration settings on the Debug Logging tab allows you to specify the events that should be logged, based on:
-
-
Packet direction
-
Transport protocol
-
Packet content
-
Packet type
-
Filter packets by IP address
-
-
You can also specify the log file path, name, and maximum size.
-
Click OK.
Troubleshooting the DNS Server using the Nslookup Command-line Tool
Nslookup is a standard TCP/IP command-line utility that can be used to perform query testing of your DNS servers. You can also use Nslookup to obtain detailed responses at the command prompt, thereby making Nslookup a good DNS name resolution diagnostic troubleshooting tool. With Windows Server 2003 DNS, you can run the Nslookup TCP/IP command-line utility straight from within the DNS console.
Nslookup can be used for the following purposes:
-
Resolve name resolution issues.
-
Debug DNS server specific issues.
-
Set options for a query.
-
Perform query testing of DNS servers.
-
Look up a specific name or resource records in a DNS zone.
-
Verify that the resource records of a zone are being added and updated correctly in that specific zone.
-
Perform zone transfers
Nslookup can be run in two modes:
-
Interactive: In this mode, a series of commands and queries can be used to obtain more than a single piece of data. Interactive mode can be accessed by entering:
-
nslookup
-
-
Noninteractive: In this mode, Nslookup is run as a simple command, executed only once to look up a single piece of information or to obtain a single piece of data. Noninteractive mode can be accessed by entering:
-
nslookup together with the syntax needed to obtain the specific information that you require.
-
If you are using Nslookup interactive mode, you can use the Set command to specify how your queries will be executed. The common options configured with the Set command are:
-
set all; displays the various options available with the set option. -
set d2; puts Nslookup in Debug mode. -
set domain=<domain name>, informs the resolver on the domain name to append for unqualified queries. -
set timeout=<timeout value>; informs the revolver on which time-out value to use. The option is typically used for slow links where queries often time out. -
set type=<record type>; informs the resolver on which type of resource records the search must be performed on. To query for all types of resource records, enter set type=all
Troubleshooting the DNS Server using the Ipconfig Command-line Tool
You can use the Ipconfig command-line tool to perform the following functions:
-
View information on DNS.
-
View DNS client settings.
-
View the contents of the DNS resolver cache.
-
Flush and reset the DNS resolver cache.
-
Register the resource records for a dynamic update client.
The common options used with the ipconfig command are:
-
ipconfig /all; shows DNS information and encompasses the FQDN and the DNS suffix search list. -
ipconfig /displaydns; shows the DNS resolver cache’s content. -
ipconfig /registerdns; refreshes and also registers DNS specific names. -
ipconfig /flushdns; flushes and also resets the DNS resolver cache.
Troubleshooting DNS Server Problems
A few guidelines for troubleshooting DNS server problems are outlined next:
-
If a client computer cannot ping a DNS server that is running, and there are no network connectivity issues, verify that the TCP/IP client configuration settings of the DNS server. Following this, verify that the DNS server itself does not a connectivity issue.
-
If clients are not obtaining any responses to name resolution requests, even though they can ping the DNS server, start by verifying that the DNS Server service is enabled and running on the DNS server.
-
If the Startup Type selector for the DNS Server service is set to Manual, the problem could be that the DNS server was restarted, but no one manually started the DNS Server service.
-
If the Startup Type selector for the DNS Server service is set to Automatic, the problem could be that the DNS Server service was purposefully stopped. Attempt to obtain additional information on the problem by examining the DNS logs in the Event Viewer tool.
-
-
If the DNS server responds to queries for name resolution but with the incorrect information, it could be that the DNS server has incorrect or outdated information in its resource records for the specific zone. This situation can be due to a number of issues, including the following:
-
If administrators are manually creating and updating resource records, then the incorrect information could have been inserted into the zone database file by the individual updating the resource records. To rectify this issue, you would have to manually verify the validity of each resource record.
-
If the DNS server is configured for dynamic updates, then your first step would be to verify that dynamic updates have indeed occurred. If no dynamic updates have occurred, then this would be the reason that the DNS server responded to client requests with outdated information. You can rectify this issue by issuing the ipconfig /registerdns command from the specific computer thats resource record is incorrect. If the issue still persists, verify that the DNS server is configured for dynamic updates.
-
The DNS server could be incorrectly resolving names from a secondary DNS server due to zone transfer not occurring for the specific secondary DNS server. This would result in the secondary zone database file containing the incorrect information. To rectify this issue, manually force a zone transfer to ensure that the secondary DNS zone database file contains updated information.
-
Follow Us!