Top is a small, but powerful program on both Unix and Linux systems. Its purpose is to allow users to monitor processes on their system.
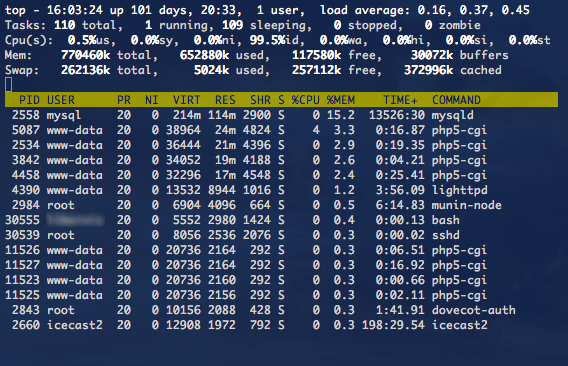
It has two main sections. The first displays general information such as the load averages, number of running and sleeping tasks, and overall CPU and memory usage. The second main section displays a sorted list of processes (usually by CPU usage) and shows their PIDs (Process ID number), the user who owns the process, running time, and CPU and memory that the process uses.
As such, Top is useful even without any further configuration. Just starting it up provides a plethora of information about the system’s resource usage. To simply find out what may be slowing a system down, for example, it might be enough to run Top and see if there is any process running at close to 100% of CPU time or using a little too much memory.
However, it is possible to configure it in a variety of ways that change how it displays information. The article will cover some top options on two of the most popular Unix variants, Mac OS X and Linux (which is technically a Unix clone).
Mac OS X Top
Top in Mac OS X is somewhat more limited than its Linux (and traditional FreeBSD) counterpart, but can still be a fairly useful tool.
To get started, run top -h to see all of the available commands and man top to see an explanation of each. A few examples will be covered to help the user get started.
Perhaps the first thing the user might want it to do is display processes sorted by what the user wants to focus on monitoring. For instance, the user might want to primarily monitor memory usage so the CPU usage’s default sorting might not quite fit the bill. To sort by memory usage, use the top -o mreg command.
The top -o command accepts a number of other keys like mreg including cpu for CPU usage, time for execution time, threads for number of threads running, user for sorting by process’s username, and so on. The full list is available in the man page (the man top command).
The user can also control how often the information shown is updated (the default is every second). To set it to update every 10 seconds just run top -s 10.
To limit how many processes in total are shown, use the top -n 10 to show just the top 10 processes.
Top on Mac has four modes of counting events, the default one being non-event mode (top -c n). The accumulative mode (top -a) counts events cumulatively since Top’s launch. The delta mode (top -d) counts events relative to the previous value. The absolute mode (top -e) counts using absolute counters.
Multiple top commands can be combined to control exactly what the user wants to see. For example, in order for Top to show processes that memory usage sorted, in delta mode, updating every 5 seconds and displaying only top 5 results simply combine all of the appropriate commands (mentioned above) and run “top -o mreg -d -s 10 -n 5.”
Linux Top
Top can be found on pretty much any Linux distribution including popular ones such as Ubuntu, Fedora, and OpenSUSE, which are among the easiest to install and try out.
The commands to get help with Top on Linux are the same on Mac OS X, Top -h for a condensed list of commands, and man Top for a much more verbose explanation of all available options.
It has a powerful interactive mode that is active by default when Top is started, and is probably going to be the primary way in which Top is operated since it provides the most flexibility and ease of use. A variety of commands can be used in the form of just letter key presses to manipulate what is being seen. Here are a few examples.
To sort processes by memory usage, simply press M (shift-m on the keyboard). To sort by CPU usage press P (shift-p). A full list of fields can be seen by pressing f , which will show the fields with their appropriate letter (which can be used to sort by that field).
With the f key, users can also opt to add a new field to display by pressing f and then the letter representing the key. For example, to add a code size field (CODE), press f then r (as shown in the field list).
Users can set the delay time for updates by just pressing s, putting in a desired number of seconds, and pressing enter. It will then update in that number of seconds, but updates can be done at any desired time by pressing the space bar.
To change the number of processes shown press n, put in the desired number, and press enter.
Users can even kill processes from within Top if a rogue process or a program of some kind will not quit or some process is using too many resources. To do so press k, enter that process’s PID (Process ID, which can be read in Top), and press enter.
Linux top also supports the cumulative mode, which can be simply toggled by pressing S (shift-s). A full list of all available interactive commands is available in the Top manual page (man top).
Of course, it is still possible to start top with some options already set. For example, top -d 5 causes Top to refresh its data every five seconds (equivalent to s and 5 in the interactive mode). The top -q displays information without any delay and runs it with the highest priority if Top is run as a superuser (or root).
Top can also be started to show only a few updates then quit automatically. Just run Top -n 10, for instance, to have Top show 10 iterations of information before quitting.
Another interesting command line option is top -b, which runs Top in a batch mode suitable for recording into a text file. Instead of just refreshing information on screen, it prints it out in batches every specified number of seconds until all iterations run out (set by -n as mentioned above) or until it is quit. To write it out into a text file called top.txt stored in a local directory, just run top -b > top.txt.
Just as in Mac OS X, it is possible to combine multiple commands to configure Top at its start. For example, run top -d 5 -n 10 to start top with a refresh rate of five seconds and have it update only 10 times before quitting.
To quit Top manually, in both OSX and Linux, just press the q key.


Will.Spencer
George:
You’re right, this article is terrible. I’ll mark it for a complete rewrite.
Will
GeorgeTheGreek
This is a deceptively-titled post, and a waste of people’s time.