An Overview on Performance Monitoring and Management
Performance monitoring is the process of accurately and consistently measuring performance, so that you can identify any potential bottlenecks which may be impairing the way in which Active Directory performs within your environment. A bottleneck can take place on any Windows subsystem or network component, and occurs when one resource prevents a different resource from operating optimally. Incorrectly configured settings or the insufficient distribution of resources between network components can result in bottlenecks occurring.
Monitoring performance can be considered the initial step in defining any performance optimization strategy for your network or network resources. Before you can optimize performance, you have to identify and eliminate existing bottlenecks, or potential bottlenecks. There are a few system and network monitoring tools provided by Windows Server 2003, which can be used to monitor Active Directory performance.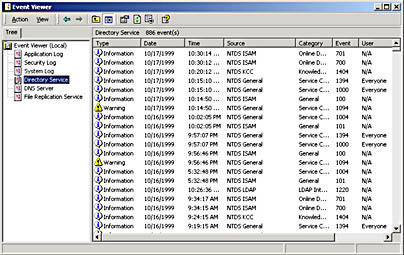
The steps involved in a typical performance monitoring process are listed below. Because performance monitoring and optimization is a continuous process, you should regularly monitor performance, especially when business needs and requirements change.
- Define a baseline of current performance.
- Identify existing and potential bottlenecks.
- Plan for, and effect any changes necessary to deal with all identified bottlenecks.
- Measure the impact or success of any implemented changes.
A few factors that should be considered when monitoring and managing performance are detailed in the following section.
- Making changes in a production environment should be done with care. You should plan for, and test all changes prior to implementing them.
- It is recommended to effect one change at a time, if you are implementing changes to improve performance. This strategy would assist you in identifying the exact change(s) which resulted in the performance increase.
- When defining the base measurements to use to monitor performance, keep the measurement component consistent.
- Keep a record of performance history, and of any changes which were implemented to improve performance.
When it comes to monitoring and managing Active Directory performance, the tasks which you typically need to perform are summarized below:
- You have to regularly monitor Active Directory to ensure the integrity and reliability of the Active Directory database, and performance of your Active Directory domains and forests. Regularly monitoring Active Directory would assist in speeding up the process of resolving performance issues.
- Error messages generated by Active Directory and the File Replication Service (FRS) are recorded in the directory service log and file replication service log in Event Viewer. You would need to firstly understand these logs, and then monitor them. Warning and informational messages are also recorded in the directory and file replication service logs.
- You can use the NTDS, FileReplicaConn, and FileReplicaSet performance objects to enable System Monitor to track Active Directory and FRS replication performance.
- An importance task associated with managing the performance of the Active Directory is defragmenting the Active Directory database. Defragmenting the Active Directory database not only improves performance, it also recovers disk space.
- To improve performance you might need to move the Active Directory database or log files to a new faster hard drive or array of hard drives. This is typically necessary when the size of the Active Directory database and components increases, and usually involves replacing your slower drives and controllers with faster drives and controllers.
Defragmenting the Active Directory Database
With Windows Server 2003 Active Directory, a garbage collection process starts each 12 hours (default) on domain controllers. The garbage collection process is a maintenance cycle that basically purges expired objects from the Active Directory database, and deletes unnecessary log files. Another function within the garbage collection process is the performance of online defragmentation of the Active Directory database, and the re-indexing of its data to enable faster access. These two functions are the last functions performed by the garbage collection process, and generally increase the performance of the Active Directory database. The online defragmentation process of the Active Directory database does not reduce the size of the database file, nor does it recover available free space from the Active Directory database.
The defragmentation of the Active Directory database is necessary because as data is deleted from the database, gaps which ultimately reduce read or write performance, exist in the data as it is located on the physical disk. Defragmenting the Active Directory database assists in keeping the database functioning at its optimal performance level for read and write operations. A read operation and write operation can be spilt into two components, namely; the data seeking component, and the data reading or writing component. With reference to a typical write operation, seeking relates to finding the next free space that you can write data to, and data writing refers to the commitment of data on the disk. When gaps exist in the data as it is located on the physical disk, seek time is increased. This in turn leads to poorer performance of the Active Directory database.
As mentioned earlier, the online defragmentation process of the Active Directory database does not reduce the size of the database file, nor does it recover available free space. You can however perform an offline defragmentation of the Active Directory database if you need to recover available free space from the database.
A number of Active Directory management and maintenance tasks can be performed using the Ntdsutil utility. These include:
- Performing an offline defragmentation of the Active Directory database.
- Performing an Active Directory database repair.
- Performing certain directory services restore operations.
- Moving the Active Directory database.
- Deleting domain controller entries from Active Directory.
To perform an offline defragmentation of the Active Directory database, you have to boot in the Directory Services Restore Mode so that the Active Directory database remains offline. In Directory Services Restore Mode, a domain controller boots without a copy of the Active Directory database. You can switch to Directory Services Restore Mode by rebooting the computer, and then pressing F8 when prompted during startup.
How to change the garbage collection interval (how often online defragmentation of the Active Directory database occurs)
You must use of the following utilities/tools to change the garbage collection interval:
- LDP.exe.
- ADSI script.
- ADSI Edit.
To change the garbage collection interval, using ADSI Edit, follow the steps below.
- Place the Windows Server 2003 CD-ROM in the CD-ROM drive.
- Start the Windows Support Tools Setup Wizard.
- On the End User License Agreement screen, click I Agree. Click Next.
- Insert your name, and the name of the organization. Click Next.
- Set the location for the installation of the support tools.
- Click Install Now. After the installation, click Finish.
- Click Start, Run, and enter mmc in the Run dialog box. Click OK.
- From th File menu, click Add/Remove Snap-in.
- When the Add/Remove Snap-in dialog box opens, click Add.
- When the Add Standalone Snap-in dialog box opens, select ADSI Edit, and then click Add.
- Click Close. Click OK to exit the Add/Remove Snap-in dialog box.
- Proceed to right-click ADSI Edit, and select Connect To from the shortcut menu.
- When the ADSI Edit Connection Settings dialog box opens, in the Select a well known Naming Context list box, choose Configuration. Click OK.
- In the left pane, expand the CN=Configuration,DC=(Domain name),DC=(Domain Name) node, expand CN=Services node, and then expand the CN=Windows NT node.
- Right-click CN=Directory Service, and choose Properties from the shortcut menu.
- When the CN=Directory Service dialog box opens, select the garbageCollPeriod option from the Attributes: list box.
- A Value column setting specified as <Not Set> means that the default collection interval of 12 hours is enabled. This means that because the garbage collection process runs each 12 hours, the online defragmentation of the Active Directory database occurs too at 12 hour intervals. The online defragmentation of Active Directory database is the last operation performed by the garbage collection process.
- To change this setting, click Edit.
- When the Integer Attribute Editor dialog box opens, set a new value (in hours) for the new garbage collection interval.
- Click OK.
- Verify that the Value column setting shows the new value which you configured.
- Click OK.
How to perform an offline defragmentation of the Active Directory database
It is recommended that you perform an offline defragmentation of the Active Directory database when you are bound to recover a considerable quantity of free space. Before performing the offline defragmentation process, you should roughly determine the quantity of free space that would result from defragmenting the database. You can do this by configuring the Directory Service to create an event log entry that estimates this figure for you.
To configure the Directory Service to create an event log that estimates what free space would be available after an offline defragmentation of the Active Directory database is performed,
- Click Start, Run, and enter regedt32.exe in the Run dialog box. Click OK.
- The Registry Editor opens.
- Locate the 6 Garbage Collection entry by expanding HKEY_LOCAL_MACHINE, SYSTEM, CurrentControlSet, Services, NTDS, and then Diagnostics.
- Proceed to double-click 6 Garbage Collection entry.
- Enter 1 in the Value Data text box.
- Click OK.
Before you perform an offline defragmentation of the Active Directory database, you should first back up system state data. System state data typically consists of boot and system files needed to start the operating system, the COM+ Class Registration database, and the Registry.
To perform an offline defragmentation of the Active Directory database,
- Reboot the computer.
- When prompted, during startup, press F8.
- In the Windows Advanced Options menu, choose the following option: Directory Services Restore Mode (Windows DCs only). Press Enter.
- Choose the operating system to start, and press Enter.
- When the Safe Mode logon prompt appears, enter the appropriate local administrator account password. Click OK.
- When a message appears, stating that Windows is running in Safe Mode, click OK.
- Proceed to open a command prompt window.
- To access the Ntdsutil utility, enter ntdsutil.
- Enter files.
- To create a defragmented copy of the Active Directory database, ener compact to <drive>:<directory>.
- Enter quit.
- Enter quit to close the Ntdsutil utility.
- In Windows Explorer, proceed to copy the new ntds.dit file to the proper location.
- In the Active Directory log files folder, delete any files containing a .LOG extension.
- Reboot the server.
Moving the Active Directory Database and Log Files
The Ntdsutil utility is used to move the Active Directory database and log files to different hard drives and controllers. You should first back up system state data before using Ntdsutil utility to move the Active Directory database and log files.
To move the Active Directory database and log files,
- Reboot the computer.
- When prompted, during startup, press F8.
- In the Windows Advanced Options menu, choose the following option: Directory Services Restore Mode (Windows DCs only). Press Enter.
- Choose the operating system to start, and press Enter.
- When the Safe Mode logon prompt appears, enter the appropriate local administrator account password. Click OK.
- When a message appears, stating that Windows is running in Safe Mode, click OK.
- Proceed to open a command prompt window.
- To access the Ntdsutil utility, enter ntdsutil.
- Enter files.
- To move the Active Directory database to a new location, enter move DB to <drive>:<directory>.
- To move the Active Directory log files to a new location, enter move logs to <drive>:<directory>.
- Enter info to verify that the Active Directory database and log files are being referenced in the correct location.
- Enter quit.
- Enter quit to close the Ntdsutil utility.
Monitoring Active Directory Performance with Events Logs and System Monitor
When monitoring Active Directory performance, it is important to bear in mind that performance issues relating to Active Directory can indeed be caused by other network infrastructure components. Therefore, when you design you strategy for monitoring Active Directory performance, you need to monitor all the other network components which essentially support the directory service. As is the case with all computers or machines in a network environment, domain controllers too have basic resource requirements.
When defining your strategy for monitoring domain controller performance within your Active Directory environment, you should typically include the following:
- Processor (CPU) time.
- Memory.
- Disk space.
- Disk I/O.
- Network utilization.
You can use the Windows Server 2003 Event Viewer tool to monitor security events, system events, application events, and events for particular services, such as directory service events. What this means is that you can use Event Viewer to monitor Active Directory. To access Event Viewer to view the event logs on a domain controller, click Start, Programs, Administrative Tools, and then click Event Viewer. The following three logs are the default logs which can be viewed in Event Viewer:
- Application log.
- System log.
- Security log.
For all event log types, other than the Security log, three different levels of events are displayed:
- Error events, Warning events, and Information events.
When Active Directory is installed, the following two additional logs are enabled:
- Directory service log.
- File replication service log.
The event logs which are of importance for monitoring the directory service are listed below:
- System: The system event log contains important information that relate to the stability and condition of the operating system. You should reguarly monitor information included in this log because it could impact the overall operation and performance of your domain controllers.
- Application: The application event log contains information on Active Directory components.
- Directory Service: The Directory service event log is the main event log used to monitor and troubleshoot Active Directory operations and performance. The log contains a vast quantity of information on Active Directory, including when the directory service starts and stops, and online defragmentation. It contains all errors, warnings and other information generated by Active Directory. Because of this, examining the Directory service event log is usually the first step in isolating Active Directory performance problems.
- File Replication Service: Because the File Replication Service (FRS) is used by Active Directory to control the replication of SYSVOL, and to synchronize the content of the SYSVOL volume over domain controllers; you might need to monitor the file replication service log. SYSVOL also contains Group Policy and replication topology connection information.
- DNS Server: In small organizations where a single server typically functions as a domain controller and DNS server, monitoring the DNS server service is quite important. Monitoring DNS is also important in Active Directory because it is used to find domain controllers and Global Catalog servers within you Active Directory domains and forests.
Windows Server 2003 includes the Performance console which can be used to monitor Active Directory. You can monitor the server on which Windows Server 2003 is installed, as well as remote servers. To open the Performance console, click Start, Programs, Administrative Tools, and then click Performance. Performance counters is the terminology used when referring to the metrics which are monitored via the Performance console. The counters are grouped in relation to the performance objects which they represent. An object is associated with a resource or service which can be monitored. What this means is that for an object, you can use the counters associated with that particular object to monitor performance.
The Performance console contains the following components.
- Counter and Trace logs.
- Alerts.
- System Monitor.
As just mentioned, System Monitor is included in the Performance console utility. When System Monitor is selected in the left pane of the Performance console utility, the right pane shows a large graph which illustrates the three recommended general system counters. These are Memory:Pages/sec, PhysicalDisk:Avg disk queue length, and Processor:%Processor time. You can use the bottom section of the graph pane to select different counters.
Through System Monitor, you can perform the following tasks:
- Gather real-time performance data from local and remote computers.
- Display current or recorded (history) performance data.
- View or display performance data in a Graph, Histogram or Report view. You can also create HTML pages from these performance views.
- Define reusable monitoring configuration parameters which you can install on different computers.
To monitor the performance of Active Directory, you have to first choose the performance object and the related performance counters which you want to monitor. The specific object which should be monitored to track Active Directory operation and performance is the NT Directory Services (NTDS) object. The counters which represent different functions, components or aspects of Active Directory are represented by the counters of the NTDS object, including:
- The Address ook (AB).
- The Asynchronous thread queue (ATQ).
- The Directory Replication Agent (DRA).
- The Directory Service (DS).
- The Key Distribution Center (KDC).
- Kerberos Authentications.
- The Lightweight Directory Access Protocol (LDAP).
- The NTLM Authentications.
- The Security Accounts Manager (SAM).
- The Extended Directory Services (XDS).
While the NTDS object is the primary object for monitoring Active Directory, you should also monitor other objects that support Active Directory. The more important counters of the NTDS object that should be used to monitor Active Directory are listed below:
- DRA Inbound Bytes Compressed (Between Sites, After Compression)/Sec; shows the compressed size of inbound compressed replication data.
- DRA Inbound Bytes Compressed (Between Sites, Before Compression)/Sec; displays the initial size of inbound compressed replication data.
- DRA Inbound Bytes Not Compressed (Within Site)/Sec; shows the bytes which were not compressed, received via inbound replication.
- DRA Inbound Bytes Total/Sec; the total bytes (compressed and uncompressed bytes) received via inbound replication.
- DRA Inbound Full Sync Objects Remaining; the number of objects remaining until the full synchronization process has been finalized.
- DRA Inbound Objects/Sec; the number of objects received from replication partners.
- DRA Inbound Objects Applied/Sec; indicates the rate that replication updates are received from replication partners, and are applied by the local directory service.
- DRA Inbound Objects Filtered/Sec; the number of objects from inbound replication partners which included no updates.
- DRA Inbound Object Updates Remaining in Packet; indicates the number of object updates in the replication update packet which are as yet not applied.
- DRA Inbound Properties Applied/Sec; specifies the number of properties replicated.
- DRA Inbound Properties Filtered/Sec; indicates the number of property changes which are already acknowledged.
- DRA Inbound Properties Total/Sec; indicates the total number of objects received from inbound replication partners.
- DRA Inbound Values (DNs Only)/Sec; indicates the number of object property values which have been received via inbound replication partners that have distinguished names.
- DRA Inbound Values Total/Sec; indicates the total number of object property values which have been received via inbound replication partners.
- DRA Outbound Bytes Compressed (Between Sites, After Compression)/Sec; shows the compressed size of outbound replication data.
- DRA Outbound Bytes Compressed (Between Sites, Before Compression)/Sec; the initial size of outbound compressed replication data.
- DRA Outbound Bytes Not Compressed (Within Site)/Sec; the bytes which were not compressed, and were replicated out.
- DRA Outbound Bytes Total/Sec; the total bytes (compressed and uncompressed bytes) which were replicated out.
- DRA Outbound Objects/Sec; the number of objects replicated out.
- DRA Outbound Objects Filtered/Sec; the number of objects from outbound replication partners which needed no updates.
- DRA Outbound Properties/Sec; indicates the number of properties which were replicated out.
- DRA Outbound Value (DNs Only)/Sec; indicates the number of object property values which have been sent to outbound replication partners that have distinguished names.
- DRA Outbound Values Total/Sec; indicates the total number of object property values which have been sent to outbound replication partners.
- DRA Pendng Replication Synchronizations; this counter becomes important if you need to ascertain what replication backlog exists.
- DRA Sync Requests Made; indicates the number of synchronization requests made to replication partners.
- DS Directory Reads/Sec; indicates the number of directory reads.
- DS Directory Writes/Sec; indicates the number of directory writes.
- DS Security Descriptor Suboperations/Sec; indicates the number of Security Descriptor Propagation suboperations.
- DS Security Descriptor Propagations Events; indicates the number of Security Descriptor Propagation events which are queued.
- DS Threads in Use; indicates the number of threads which the directory service is currently utilizing.
- LDAP Bind Time; indicates the time which the last successful LDAP binding took.
- LDAP Client Sessions; shows the number of clients which are connected to the LDAP service.
- LDAP Searches/Sec; displays the number of LDAP search operations performed by LDAP clients.
- LDAP Successful Binds/Sec; indicates the number of successful LDAP binds.
- Kerberos Authentications; shows the number of domain authentications occurring using the Kerberos authentication protocol.
- NTLM Authentications; shows the number of domain authentications occurring using the NTLM authentication protocol.
The important counters of the FileReplicaSet object that should be monitored as part of your Active Directory monitoring strategy are listed below:
- Change Orders Received; indicates how many change notifications were received from inbound partners.
- Change Orders Sent; indicates how many change notifications were sent to outbound partners.
- File Installed, shows the number of replicated files installed.
- KB of Staging Space Free; shows the amount of free space in the staging directory. This is where FRS stores files prior to replicating them.
- KB of Staging Space In; indicates the amount of space being used by FRS in the staging directory.
- Packets Received; shows the number of FRS data and control packets that FRS received.
- Packets Sent; shows the number of FRS data and control packets sent by FRS.
- USN Records Accepted; shows the number of records which were approved for replication.
Other important System, Processor, and Memory object counters that should be monitored when monitoring Active Directory are listed below.
- System object counters:
- Context Switches/sec; can be used to determine whether or not the number of applications which the processor has to handle is too many.
- Processor Queue Length; indicates whether or not the system is able to handle processing requests.
- Processor object counters:
- % Processor Time; can be used to monitor the usage of processor resources in the particular domain controller.
- % DPC Time; shows when processes were delayed in executing, due to the domain controller being occupied.
- Memory object counters:
- Page Faults/sec; shows when code has to be accessed from the page file. The counter can therefore be used to determine whether additional physical RAM is needed.
- Available Mbytes; shows the amount of available system memory.
- PhysicalDisk: Current Disk Queue Length counter; can be used to monitor how many disk reads and writes are pending.
How to monitor Active Directory performance with System Monitor
- Click Start, Administrative Tools, and then click Performance.
- In the left pane, click the System Monitor ode.
- In the right pane, right-click on the System Monitor graph and then select Add Counters from the shortcut menu.
- When the Add Counters dialog box opens, click Use Local Computer Counters if you want to monitor the computer on which System Monitor is installed, or click Select Counters From Computer if you want to monitor another computer.
- In the Performance Object drop down box, select NTDS.
- If you want to monitor all counters of the NTDS object, click All Counters.
- If you only want to monitor certain counters, click Select Counters From List, and then choose the counters which you want to monitor by selecting the counter and clicking Add.
- Click Close.
- The counters which you have just enabled should be displayed under the graph in the right pane of System Monitor.
Monitoring Active Directory Performance with Performance Logs and Alerts
You can use the functionality of the Performance Logs and Alerts to create counter logs, trace logs, and system alerts automatically from the local computer or a remote computer.
- Counter logs: You can use counter logs to gather performance data on resources and services. You can view and analyze any data collected by counter logs in System Monitor, or you can alternatively export the data to a spreadsheet or database application.
- Trace logs: You can use trace logs to gather event traces which determine performance statistics related to events such as page faults, and disk I/O.
- Alerts: You can use alerts to set when a specific counter value should trigger a specific action; such as sending an email to a designated user, running a program, or logging an entry in a log file.
How to create a counter log
- Click Start, Administrative Tools, and then click Performance.
- When the Performance console opens, double-click Performance Logs And Alerts, and then click Counter Logs.
- Right-click in a blank portion of the details pane, and then select New Log Settings from the shortcut menu.
- When the New Log Settings dialog box opens, enter a name for the new counter log in the Name box. Click OK.
- On the General tab, verify that the information in the Current Log File Name box is the correct information for the filename and path of the log file.
- Click the Add Counters button.
- When the Add Counters dialog box appears, select the Use Local Computer Counters option, or click the Select Counters From Computer option and specify the UNC name of the computer that you want to monitor.
- In the Performance Object drop down box, select NTDS.
- If you want to monitor all counters of the NTDS object, click All Counters.
- If you only want to monitor certain counters, click Select Counters From List, and then choose the counters which you want to monitor by selecting the counter and clicking Add.
- Click Close.
- On the General tab, in the Sample Data Every section of the tab, set the appropriate values in the Interval and Units boxes.
- Click the Log Files tab, and choose either Text File (Comma Delimited), Text File (Tab Delimited), Binary File, Binary Circular File or SQL Database.
- Click Configure.
- When the Configure Log Files dialog box opens, in the Locations box, enter the location of the folder in which the log file should be created.
- In the Log File Size area, choose either the Maximum Limit option; or the Limit Of option and set the size to which data should be collected. Click OK.
- In the Log Files tab, click End File Names With, and then select the log file suffix.
- You can enter a descripton for the log file in the Comment box.
- If you want to overwrite an existing log file with this particular log file, click Overwrite Existing Log File.
- Click the Schedule tab, and set the appropriate schedule options for the counter log.
- Click OK.
How to create a trace log
- Click Start, Administrative Tools, and then click Performance.
- When the Performance console opens, double-click Performance Logs And Alerts, and then click Trace Logs.
- Right-click in a blank portion of the details pane, and then select New Log Settings from the shortcut menu.
- When the New Log Settings dialog box opens, enter a name for the new trace log in the Name box. Click OK.
- Select one of the following options:
- Events Logged By System Provider and then proceed to specify events that should be logged;
- Nonsystem Providers and the click Add to choose the appropriate nonsystem providers.
- Click the Log Files tab, and set the necessary settings for the log file.
- Click the Schedule tab, and set the appropriate schedule options for the trace log.
- Click OK.
How to create an alert
- Click Start, Administrative Tools, and then click Performance.
- When the Performance console opens, double-click Performance Logs And Alerts, and then click Alerts.
- Right-click in a blank portion of the details pane, and then select New Alert Settings from the shortcut menu.
- When the New Alert Settings dialog box opens, enter a name for the new alert in the Name box. Click OK.
- Enter a comment for the alert in the Comment box on the General tab.
- Click Add.
- In Add Counters dialog box, specify the computer for which you want to create this alert.
- In the Performance Object list, choose NTDS.
- Choose the particular counters which you want to monitor, and then click Add. Click Close
- On the General tab, in the Alert When The Value Is box, set either Under or Over.
- In the Limit box, enter the value which should trigger the alert.
- In the Sample Data Every section of the tab, set the appropriate values in the Interval and Units boxes.
- Click the Action tab, and select between the following options:
- Log An Entry In The Application Event Log.
- Send A Network Message To.
- Start Performance Data Log.
- Run This Program.
- Command Line Arguments.
Click OK.
- Click the Schedule tab, and set the appropriate schedule options.
- Click OK.
Best Practices for Monitoring Active Directory Performance
A few best practices for monitoring Active Directory performance using Event Logs, System Monitor, and Performance Logs and Alerts are outlined in below.
- You should strive to keep any overhead relating to monitoring Active Directory performance using System Monitor at a minimal figure. Using the System Monitor graph, and specifying a vast number of objects and counters for monitoring, results in an increase in monitoring overhead.
- Because running System Monitor typically consumes resources, you should perform certain tasks on the computer to conserve resources before using the tool. These should include disabling services and screen saver programs which are not needed for the performance monitoring process. The same measure should be used when using Performance Logs And Alerts to monitor performance.
- You should increase the size of the paging file to one and a half times the size of the physical memory of the computer before running System Monitor. The ame measure should be used when using Performance Logs And Alerts to monitor performance.
- Logging information in log files also affects performance. This is because of the file size, and the available disk space needed by log files. Lengthening the update interval could assist in keeping the overhead associated with the directory service log file at an acceptable figure.
- When monitoring performance with Performance Logs And Alerts, use the following strategies:
- You should keep all logs for a set time duration.
- Data gathered from these logs should be stored in a database. This allows you to analyze and query the data as necessary.
Follow Us!